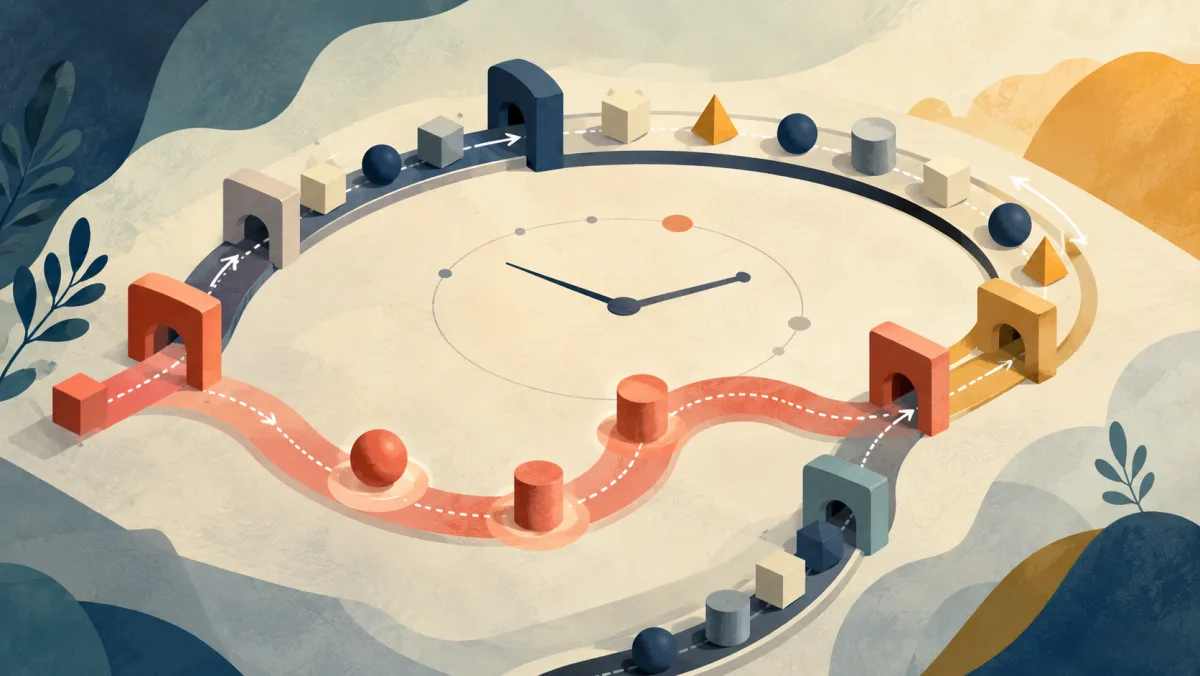
Throughput, latency, and cycle time can describe the same system, but each metric answers a different question.
"Throughput" measures completed volume per period. "Latency" measures a delay, such as request response time, while "cycle time" measures one item's duration between defined start and finish points. A system can show high throughput while some items still take a long time.
Quick check
Healthy total, slow individual item
You know "Throughput" well.
Keep going with the full learning path — more workplace contexts, related expressions, and practice using it yourself with feedback.
Continue with "Throughput" →There's more to "Throughput" than it seems.
You've got part of it, but the full learning path goes deeper into its nuances, workplace contexts, and when it sounds natural — then gives you practice using it yourself.
Learn "Throughput" in depth →Many items, or one item's wait
Latency and cycle time both differ from throughput in one basic way. Throughput covers completed volume across many items. The other metrics describe time or delay for an item or request. Still, latency and cycle time are not identical. Teams must define the start and finish points for cycle time.
The API's throughput held at a high rate even during the incident, but per-request latency crept up as retries piled on.
Support throughput looked healthy overall, yet individual tickets took days from active work to completion -- a cycle-time problem throughput alone doesn't show.
A batch process can have excellent throughput and still leave any one record waiting through several batch cycles before it's actually processed.
Try it yourself
Report both views of flow
Why a healthy aggregate number can hide a bad individual experience
The examples show an aggregate measure and an item-level experience. These are not the same measurement. A throughput-only dashboard can therefore miss long delays. A support queue may complete many tickets while one ticket waits for days. Throughput was not designed to show that ticket's history.
The mistake
Do not assume a high aggregate rate means every item finishes quickly. High throughput and a long item duration can occur together, so the readings are not contradictory. Check each metric separately and use the correct time boundary.
Why both numbers belong on the same dashboard
A team that reports throughput alone may focus too much on volume. Some changes can raise throughput while increasing item-level delays. Batching is one possible example. Report throughput beside the relevant time metric. Then a trade-off becomes easier to see before customers complain.
"Throughput looks fine" does not answer why one customer is waiting. The questions need different evidence. Latency may fit a request delay. Cycle time may fit work already inside a defined workflow. Lead time or queue age may fit waiting before active work begins. Track the metric that matches the question.
Practice scenarios
Practice using throughput in situations like:
- explaining why healthy throughput doesn't guarantee a fast individual wait time
- diagnosing a queueing problem that an aggregate throughput number wouldn't catch
- reporting both throughput and latency or cycle time together for a fuller picture
Useful practice phrases:
- "Throughput held steady, but per-request latency crept up because..."
- "Throughput looked healthy overall, yet individual items were sitting in a queue for..."
- "A high throughput number doesn't tell us how long any one item is waiting."
Want to actually use "Throughput" naturally at work?
Understanding it is one thing. Practice its nuances, see how it works in real workplace situations, and use it yourself with feedback.
Start the "Throughput" learning path →Throughput describes the crowd. Latency or cycle time can describe one item's experience.
Track the relevant measures together, because an aggregate number can hide long delays.